
AB InBev Reports First Quarter 2024 Results
08.05.2024 - 08:01:00AB InBev Reports First Quarter 2024 Results. Consistent execution of our strategy delivered a 5.4% EBITDA increase with margin expansion, and 16% Underlying EPS growth
Anheuser-Busch InBev (Brussel:ABI) (BMV:ANB) (JSE:ANH) (NYSE:BUD):
This press release features multimedia. View the full release here: https://www.businesswire.com/news/home/20240507296313/en/
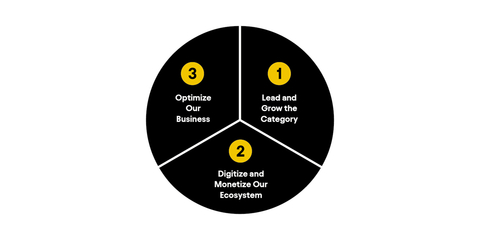
ABI Strategic Priorities - English (Graphic: Business Wire)
Regulated information1
We are encouraged by our results to start the year, and the consistent execution by our teams and partners reinforces our confidence in delivering on our 2024 growth ambitions.” – Michel Doukeris, CEO, AB InBev|
Total Revenue + 2.6% Revenue increased by 2.6% with revenue per hl growth of 3.3%.
6.7%increase in combined revenues of our megabrands, led by Corona, which grew by 15.5% outside of its home market.
Approximately 70%of our revenue is through B2B digital platforms with the monthly active user base of BEES reaching 3.6 million users.
Approximately 130 million USDof revenue generated by our digital direct-to-consumer ecosystem.
Total Volume - 0.6% Total volumes declined by 0.6%, with own beer volumes down by 1.3% and non-beer volumes up by 3.5%. |
Normalized EBITDA + 5.4% Normalized EBITDA increased by 5.4% to 4 987 million USD with a normalized EBITDA margin expansion of 90 bps to 34.3%.
Underlying Profit 1 509 million USD Underlying profit (profit attributable to equity holders of AB InBev excluding non-underlying items and the impact of hyperinflation) was 1 509 million USD in 1Q24 compared to 1 310 million USD in 1Q23.
Underlying EPS 0.75 USD Underlying EPS was 0.75 USD in 1Q24, an increase from 0.65 USD in 1Q23.
|
|
1The enclosed information constitutes regulated information as defined in the Belgian Royal Decree of 14 November 2007 regarding the duties of issuers of financial instruments which have been admitted for trading on a regulated market. For important disclaimers and notes on the basis of preparation, please refer to page 12. |
Management comments
Consistent execution of our strategy delivered a 5.4% EBITDA increase with margin expansion, and 16% Underlying EPS growth
Top-line increased by 2.6%, with revenue growth in approximately 75% of our markets, driven by a revenue per hl increase of 3.3% as a result of revenue management initiatives and ongoing premiumization. Volumes declined by 0.6%, as growth in our Middle Americas, South America, Africa and Europe regions was offset by performance in APAC and North America. EBITDA increased by 5.4% with disciplined overhead management enabling increased sales and marketing investments in our brands and EBITDA margin expansion of 90bps. Underlying EPS was 0.75 USD, a 16% increase versus 1Q23, driven primarily by nominal EBITDA growth and the continued optimization of our business.
Progressing our strategic priorities
We continue to execute on and invest in three key strategic pillars to deliver consistent growth and long-term value creation.
1. Lead and grow the category:
We delivered volume growth and market share gains in the majority of our markets, according to our estimates.
2. Digitize and monetize our ecosystem:
BEES captured 11.3 billion USD of gross merchandise value (GMV), a 23% increase versus 1Q23 with approximately 70% of our revenue through B2B digital channels. BEES Marketplace is live in 19 markets and captured 465 million USD in GMV from sales of third-party products, a 47% increase versus 1Q23.
3. Optimize our business:
Underlying EPS increased by 16% to reach 0.75 USD, driven by nominal EBITDA growth, margin expansion and optimization of our net finance costs.
1. Lead and grow the category
We are executing on our five proven and scalable levers to drive category expansion. Our performance across each of the levers was led by our megabrands, which represent the majority of our revenue and delivered a 6.7% revenue increase.
- Category Participation: Through our focus on brand, pack and liquid innovations, the percentage of consumers purchasing our portfolio of brands increased in approximately 40% of our markets, according to our estimates. Participation increases were led by female consumers across key markets in Latin America and Europe.
- Core Superiority:Our mainstream portfolio delivered a low-single digit revenue increase driven by double-digit growth in South Africa, Colombia and the Dominican Republic.
- Occasions Development: Our global no-alcohol beer portfolio delivered high-teens revenue growth, with our performance led by Corona Cero and Budweiser Zero. The combination of our digital direct-to-consumer (DTC) products and our megabrands are developing new consumption occasions. In Brazil, Zé Delivery executed a Carnival campaign focused on facilitating home-based events with in-app promotions while enhancing the out-of-home experience with access to exclusive festival events.
- Premiumization:Our above core beer portfoliogrew revenue by low-single digits driven by our global brands and the double-digit growth of other local megabrands such as Leffe in Europe and Spaten in Brazil. Our global brands grew revenue by 5.2% outside of their home markets, led by Corona which grew by 15.5%.
- Beyond Beer:Our global Beyond Beer business contributed approximately 320 million USD of revenue with a low-single digit volume increase versus 1Q23, as growth globally was partially offset by a soft malt-based seltzer industry in the US. Growth was primarily driven by our spirits-based ready-to-drink and flavored malt beverage portfolios in the US and the expansion of Brutal Fruit in Africa.
2. Digitize and monetize our ecosystem
- Digitizing our relationships with more than 6 million customers globally: As of 31 March 2024, BEES is live in 26 markets with approximately 70% of our 1Q24 revenues captured through B2B digital platforms. In 1Q24,BEES had 3.6 million monthly active users and captured 11.3 billion USD in gross merchandise value (GMV), growth of 16% and 23% versus 1Q23 respectively.
BEES Marketplace is live in 19 markets, generated 7.3 million orders and captured 465 million USD in GMV from sales of third-party products, growth of 35% and 47% versus 1Q23 respectively. - Leading the way in DTC solutions: Our omnichannel DTC ecosystem of digital and physical products generated revenue of approximately 350 million USD. Our DTC megabrands, Zé Delivery, TaDa and PerfectDraft, are available in 21 markets, generated 18.1 million ecommerce orders and delivered approximately 130 million USD in revenue, representing low-teens growth versus 1Q23.
3. Optimize our business
- Maximizing value creation:Our Underlying EPS was 0.75 USD, a 16% increase versus 1Q23, driven primarily by nominal EBITDA growth, margin expansion and continued optimization of our net finance costs. We continue to proactively manage our debt portfolio. In April 2024, we completed a 2.5 billion USD cash tender offer for outstanding bonds following the issuance of 4 billion Euro and 1 billion USD in new bonds in March 2024. These transactions improved our debt maturity profile while maintaining our weighted average gross debt coupon at approximately 4%. With increased flexibility in our capital allocation choices, we completed our 1 billion USD share buyback program announced on 31 October 2023 and executed an additional 200 million USD direct share buyback from Altria.
- Advancing our sustainability priorities: In Climate Action, our Scopes 1 and 2 emissions per hectoliter of production was 4.25 kgCO2e/hl in 1Q24, a reduction of approximately 6% from 1Q23. In Water Stewardship, we continue to work towards our ambition to reach a water use efficiency ratio of 2.5 hl per hl by 2025 with a water efficiency ratio of 2.55 hl/hl in 1Q24 versus 2.56 hl/hl in 1Q23. Collaboration is key to achieving a more sustainable future and, this quarter, we were named a top 2023 Supplier Engagement Leader by CDP.
Creating a future with more cheers
Our business delivered another quarter of profitable growth with an EBITDA increase of 5.4%, margin expansion of 90bps and double-digit Underlying EPS growth. We are investing for the long-term and continue to build on our platform to generate value for our stakeholders. The beer category is large and growing, and our unique global leadership advantages, replicable growth drivers and superior profitability position us well to deliver on our purpose to create a future with more cheers.
2024 Outlook
- Overall Performance: We expect our EBITDA to grow in line with our medium-term outlook of between 4-8%. The outlook for FY24 reflects our current assessment of inflation and other macroeconomic conditions.
- Net Finance Costs: Net pension interest expenses and accretion expenses are expected to be in the range of 220 to 250 million USD per quarter, depending on currency and interest rate fluctuations. We expect the average gross debt coupon in FY24 to be approximately 4%.
- Effective Tax Rates (ETR): We expect the normalized ETR in FY24 to be in the range of 27% to 29%. The ETR outlook does not consider the impact of potential future changes in legislation.
- Net Capital Expenditure: We expect net capital expenditure of between 4.0 and 4.5 billion USD in FY24.
|
Figure 1. Consolidated performance (million USD) |
||||||
|
1Q23 |
1Q24 |
Organic |
||||
|
|
|
growth |
||||
|
Total Volumes (thousand hls) |
140 548 |
139 536 |
-0.6% |
|||
|
AB InBev own beer |
121 060 |
119 387 |
-1.3% |
|||
|
Non-beer volumes |
18 587 |
19 230 |
3.5% |
|||
|
Third party products |
901 |
919 |
2.0% |
|||
|
Revenue |
14 213 |
14 547 |
2.6% |
|||
|
Gross profit |
7 696 |
7 894 |
2.7% |
|||
|
Gross margin |
54.1% |
54.3% |
3 bps |
|||
|
Normalized EBITDA |
4 759 |
4 987 |
5.4% |
|||
|
Normalized EBITDA margin |
33.5% |
34.3% |
90 bps |
|||
|
Normalized EBIT |
3 503 |
3 642 |
5.0% |
|||
|
Normalized EBIT margin |
24.6% |
25.0% |
56 bps |
|||
|
|
||||||
|
Profit attributable to equity holders of AB InBev |
1 639 |
1 091 |
||||
|
Underlying profit attributable to equity holders of AB InBev |
1 310 |
1 509 |
||||
|
|
||||||
|
Earnings per share (USD) |
0.81 |
0.54 |
||||
|
Underlying earnings per share (USD) |
0.65 |
0.75 |
|
|
Figure 2. Volumes (thousand hls) |
||||||||||||
|
1Q23 |
Scope |
Organic |
1Q24 |
Organic growth |
||||||||
|
|
|
growth |
|
Total |
Own beer |
|||||||
|
North America |
23 853 |
- 155 |
-2 345 |
21 353 |
-9.9% |
-11.1% |
||||||
|
Middle Americas |
34 271 |
- 5 |
1 424 |
35 690 |
4.2% |
4.5% |
||||||
|
South America |
40 286 |
- |
61 |
40 347 |
0.2% |
-0.6% |
||||||
|
EMEA |
19 958 |
- |
1 072 |
21 030 |
5.4% |
4.8% |
||||||
|
Asia Pacific |
22 114 |
- |
-1 069 |
21 045 |
-4.8% |
-4.7% |
||||||
|
Global Export and Holding Companies |
66 |
- |
4 |
70 |
5.7% |
7.5% |
||||||
|
AB InBev Worldwide |
140 548 |
- 160 |
- 853 |
139 536 |
-0.6% |
-1.3% |
||||||
Key Market Performances
United States: Revenue declined by high-single digits impacted by volume performance
- Operating performance: Revenue declined by 9.1% with revenue per hl increasing by 1.1% driven by revenue management initiatives. Sales-to-retailers (STRs) were down by 13.7%, primarily due to the volume decline of Bud Light. Sales-to-wholesalers (STWs) declined by 10.1% as 1Q24 shipments caught up with the stronger depletions in December 2023. EBITDA declined by 17.9%, as top-line performance and support measures for our wholesaler partners were partially offset by productivity initiatives.
- Commercial highlights: The beer industry remained resilient, with dollar sales continuing to grow versus last year, according to Circana. Our beer market share continued to improve sequentially. While mainstream beer volumes declined, our above core beer megabrands volume continued to grow. In Beyond Beer, our spirits-based ready-to-drink portfolio delivered strong double-digit volume growth, outperforming the industry.
Mexico: Mid-single digit top- and bottom-line growth with margin expansion
- Operating performance: Revenue increased by mid-single digits, with low-single digit revenue per hl growth driven by revenue management initiatives.Volumes grew by mid-single digits, in-line with the industry, which was supported by the phasing impact of an earlier Easter. EBITDA grew by mid-single digits with continued margin expansion.
- Commercial highlights: Our core brands delivered mid-single digit volume growth and our above core portfolio continued to grow, led by the strong performance of Modelo and Pacifico. We continued to progress our digital initiatives, with our digital DTC platform, TaDa, reaching 100 000 monthly active users and fulfilling more than 350 000 orders in March.
Colombia: Record high volumes delivered double-digit top-line and high-single digit bottom-line growth
- Operating performance: Revenue grew by mid-teens, with high-single digit revenue per hl growth, driven by pricing actions and revenue management initiatives. Volumes grew by mid-single digits, with our portfolio continuing to gain share of total alcohol. EBITDA grew by high-single digits as top-line growth was partially offset by anticipated transactional FX headwinds.
- Commercial highlights: Driven by the consistent execution of our expansion levers, the beer category continues to grow, with both the category and our first quarter volumes reaching a new record high. Our mainstream portfolio led our performance, delivering mid-teens revenue growth with a strong performance from Aguila. Our premium and super premium brands grew volumes by more than 20%, led by Corona.
Brazil: Record high volumes delivered mid-single digit top-line and double-digit bottom-line growth with margin expansion of 311bps
- Operating performance: Revenue grew by 5.8% with revenue per hl growth of 1.4% driven by revenue management initiatives. Total volumes grew by 4.4%, with beer volumes increasing by 3.6%, outperforming the industry according to our estimates. Non-beer volumes increased by 6.5%. EBITDA increased by 16.9% with margin expansion of 311bps.
- Commercial highlights: Our premium and super premium brands continued to outperform, delivering low-teens volume growth led by Corona and Spaten, and driving record high first quarter total volumes. Our core beer portfolio remained healthy, increasing volumes by low-single digits. Our digital DTC platform, Zé Delivery, generated over 16 million orders, an 11% increase versus last year, with GMV growing by 12%.
Europe: High-single digit top-line and strong double-digit bottom-line growth with margin recovery
- Operating performance: Revenue increased by high-single digits with revenue per hl growth of mid-single digits, driven by pricing actions and continued premiumization. Volumes grew by mid-single digits, outperforming the industry in more than 80% of our key markets according to our estimates, and supported by the phasing impact of an earlier Easter. EBITDA grew by strong double-digits with margin recovery driven by top-line growth and cost efficiencies.
- Commercial highlights: We continued to premiumize our portfolio in Europe, with our premium and super premium portfolio now making up approximately 56% of our revenue. Our megabrands delivered double-digit revenue growth, led by Corona. Corona Cero, the global beer sponsor of the Olympic Games, is now available in 22 markets across Europe and grew revenue by strong double-digits.
South Africa: Record high volumes delivered double digit top- and bottom-line growth with margin expansion
- Operating performance: Revenue increased by mid-teens, with revenue per hl growth of high-single digits, driven by pricing actions and continued premiumization. Volumes grew by mid-single digits, continuing to outperform the industry in both beer and beyond beer according to our estimates. EBITDA grew by mid-twenties with margin expansion.
- Commercial highlights: The momentum of our business continued, again delivering record high volumes for the first quarter and with our portfolio gaining share of both beer and total alcohol, according to our estimates. Our performance was led by our super premium portfolio, which grew volumes by double-digits driven by Corona and Stella Artois, and the continued strength of our core brands which delivered double-digit revenue growth.
China: Continued premiumization with margin expansion despite soft industry
- Operating performance: Revenue declined by 2.7% with revenue per hl increasing by 3.7%, driven by continued premiumization. Total volumes declined by 6.2%, in-line with the industry according to our estimates, which was impacted by cycling channel reopening in 1Q23 and adverse weather in March 2024. EBITDA increased by 0.5% with margin expansion of 137bps.
- Commercial highlights: We continue to invest behind our commercial strategy, focused on premiumization, channel and geographic expansion, and digital transformation. Our premium brands continued to grow volumes, led by Budweiser, and the share of our total volume generated by our premium and super premium portfolio increased by 250bps.
Highlights from our other markets
- Canada: Revenue declined by mid-single digits with revenue per hl growth of low-single digits driven by revenue management initiatives and continued premiumization. Our overall volumes declined by high-single digits, impacted by a soft industry and cycling a strong performance in 1Q23.
- Peru: Revenue and revenue per hl increased by mid-single digits, driven primarily by revenue management initiatives. Volumes grew by low-single digits, gaining share of total alcohol, driven by the performance of our leading core brand Pilsen Callao.
- Ecuador: Revenue grew by low-teens with volumes increasing by double-digits, continuing to gain share of total alcohol. Our core beer brands led our growth, delivering a mid-teens volume increase.
- Argentina: Volumes declined by high-teens as overall consumer demand was impacted by inflationary pressures. For FY24, the definition of organic revenue growth in Argentina was amended to cap the price growth to a maximum of 2% per month (26.8% year-over-year). Revenue increased by low-single digits on this basis.
- Africa excluding South Africa: In Nigeria, our beer volumes grew by high-teens, supported by a favorable comparable from the industry impact of temporary currency shortages in 1Q23. Revenue grew by more than 80%, driven by revenue management initiatives in a highly inflationary environment. In our other markets in Africa, we grew revenue in aggregate by high-single digits driven by Zambia, Botswana, Tanzania and Uganda.
- South Korea: Total revenue increased by mid-single digits with revenue per hl increasing by high-single digits, driven by revenue management initiatives. Volumes declined by mid-single digits, outperforming a soft industry which cycled a strong performance in 1Q23. Our performance was driven by Cass, which gained market share in both the on-premise and in-home channels.
Consolidated Income Statement
|
Figure 3. Consolidated income statement (million USD) |
||||||
|
1Q23 |
1Q24 |
Organic |
||||
|
growth |
||||||
|
Revenue |
14 213 |
14 547 |
2.6% |
|||
|
Cost of sales |
-6 517 |
-6 653 |
-2.5% |
|||
|
Gross profit |
7 696 |
7 894 |
2.7% |
|||
|
SG&A |
-4 344 |
-4 435 |
-1.4% |
|||
|
Other operating income/(expenses) |
152 |
183 |
18.3% |
|||
|
Normalized profit from operations (normalized EBIT) |
3 503 |
3 642 |
5.0% |
|||
|
Non-underlying items above EBIT (incl. impairment losses) |
-46 |
-29 |
|
|||
|
Net finance income/(cost) |
-1 237 |
-1 187 |
|
|||
|
Non-underlying net finance income/(cost) |
375 |
- 309 |
|
|||
|
Share of results of associates |
50 |
57 |
@ businesswireindia.com
  |